HOW I USE…Task Manager
Will Stapley on how to use the tool for more than just killing unresponsive programs.
Compared with previous versions of the operating system, Windows 10 runs incredibly smoothly, with those dreaded blue screens of death now few and far between. However, it still throws up the occasional unresponsive program. And when that happens, what do I do? I turn to good ol’ Task Manager (Ctrl+Shift+Escape), which usually helps me identify the culprit in just a few seconds.

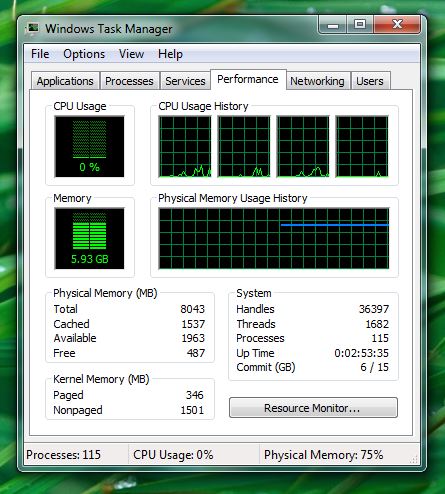
But there’s more to Task Manager than identifying stalled programs. Recently, I was just a few minutes into using my laptop when the fans ramped up and even simple tasks such as opening a new File Explorer window took an age. I opened Task Manager, clicked the Performance tab and noticed both my CPU and Disk usage were touching 100 percent capacity. So I sorted the Processes tab by CPU and Google Drive was revealed as the culprit.
I’d recently copied a number of large files on to my desktop, and because I set Google Drive to sync all desktop files and folders it soon started working up a sweat. Instead of forcing this background process to close, I opted to pause Google Drive by right-clicking its icon in the notification area. I’ve learnt not to be quite so trigger happy with the force-close option, instead using Task Manager to find less drastic solutions. It also reduces the risk of
Add power-usage info to Task Manager by right-clicking the column header in the Processes tab losing unsaved data.

I often tweak Task Manager to provide additional info. For example, right- clicking the column headers in any Task Manager tab lets me add extra columns, including one showing each program’s command line. In our Remove Hidden Junk cover feature (Issue 540, page 50), we explained how this helped to identify a mysterious startup item that simply called itself Program.
One trick that can kick an unresponsive computer back into life is to restart the Windows Explorer process (this controls tools such as the taskbar and Start button). Task Manager provides a handy shortcut for this – I simply locate the Windows Explorer entry in the Process tab, right-click it, then select Restart.
Since the October Update, Task Manager also offers power-usage columns, which identify which processes are draining your laptop’s battery (you can view this data in the Processes tab, but you may need to make the columns visible, as they are in the screenshot above. The first column, ‘Power usage’, gives a real-time record of how much each program is draining your battery. However, I find the second column, ‘Power usage trend’, more handy because it shows which processes have drained most power since they were loaded – useful when my battery is running low.
Task Manager also acts as a springboard for other tools. In the Performance tab, for example, I can get more info about the impact each program is having on my computer by clicking the Open Resource Monitor link at the bottom. If I struggle to identify a process or service, I select Search Online and up pops a related Bing search (you can’t change to another search engine, unfortunately).
If there’s one aspect of Task Manager I barely touch, it’s the App History tab. Introduced in Windows 10, it shows performance stats, but only for Microsoft Store apps – in my case, it simply highlights how little I use them.
WHAT I’D LIKE TO SEE IN TASK MANAGER
I often use the Performance tab to find out whether it’s my processor, memory or disk usage that’s causing my computer to slow down (or all three). However, Task Manager’s graphs only show information for the previous 30 seconds (see screenshot) when the ‘Update speed’ is set to High – and it only starts tracking after I click the Performance tab. I’d like to see performance graphs cover a full minute, perhaps with the ability to click any point in the graph to reveal the biggest resource-eating processes at that moment.
See also: Keep Your PC Healthy


