PC SERVICE and TUNE-UP GUIDE
ENSURE YOUR PC REMAINS IN TIP-TOP SHAPE AND FIGHTING CONDITION WITH THE HELP OF NICK PEERS. Read our PC SERVICE and TUNE-UP GUIDE.
All mechanical products require maintenance to keep them running. You get your truck or car serviced at regular intervals to ensure that failing parts are spotted and replaced, while tuning the engine to improve performance and efficiency, so why not your PC too?
In this feature, we’ve developed a simple program to help you ensure that your PC’s hardware is running as well as it possibly can. We’ll start by showing you how to audit your system so you can identify everything that’s in it, from the stuff you should already know about (like your graphics card model or CPU), to more obscure components (what USB controllers is your motherboard using, for instance?).
From there, we’ll put in place tools that can help you monitor your system, providing you with early warnings for the parts that may be on their way out, from ageing hard drives to batteries in a state of decline. You’ll learn how to identify other potential problems through stress-testing, before we switch our attention to examining ways to tune your hardware for better performance, from basic updates to judicious overclocking of selected components.
Ready to put your PC through its paces? Let’s get started.
The first step to maintaining your PC is to perform a complete hardware audit. This provides you with a detailed inventory of the various components that make up your PC – ncluding the chipsets that populate your motherboard, allowing you to monitor key aspects of them.
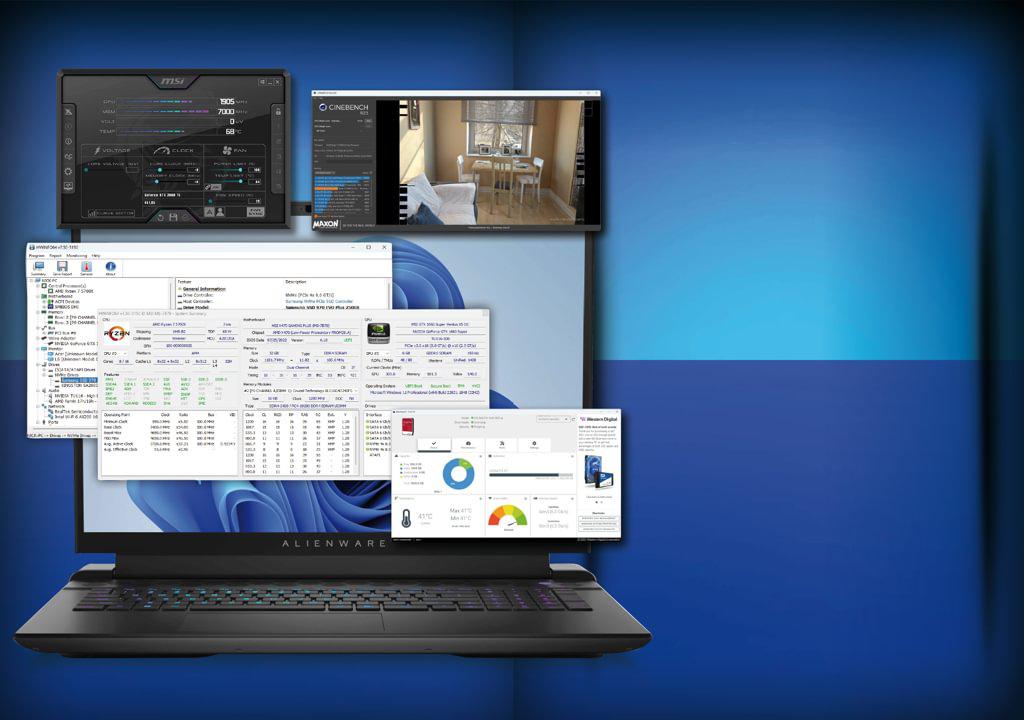
Our current tool of choice is HWiNFO (www.hwinfo.com), which is free for personal use, and can be installed or deployed as a portable app. After setting it up, launch HWiNFO and give it administrator access when prompted. You’ll be prompted to start the app, which comprises three main windows: Main, Summary, and Sensors.
Once your system has been profiled, the Summary screen will display a three-paned window presenting information about your CPU, motherboard, and GPU. This provides quite detailed information about all three components – for example, the CPU pane displays your processor model, its TDP (thermal dynamic power), platform, and supported features, as well as clock information.
The Motherboard section reveals what chipset is powering your motherboard, as well as information about your system RAM: how much, its type, and clock speeds, whether it’s running in dual-channel mode, and timings. Beneath this, the Memory Modules section lets you examine the capabilities of each individual stick.
Finally, on the right-hand side, you’ll see information about your GPU, including the PCIe bus it’s on and its underlying architecture. You’ll also see at-a-glance information about your storage, boot setup (including whether it’s configured for UEFI and Secure boot, and if a TPM is present), and finally a Windows version and build number.
TAKE A DEEPER DIVE
This is all useful information, but it merely scratches the surface of what HWiNFO can tell you about your system. Switch to the main window, which works in a similar – but dare we say it, more logical – fashion to Device Manager.

You’ll see categories for your CPU, motherboard, memory, bus, video adapter, monitor, drives, audio setup, network, and ports, covering just about every aspect of your PC. While the System Summary provides a pretty detailed overview of your key components, it barely scratches the surface of what you can find out here.
For example, if you expand Motherboard > SMBIOS DMI and select BIOS, you can get details about your motherboard’s current BIOS version and TPM version. Turn your attention to the System Slots section, and you can get an overview of what PCI-E and non-storage M.2 slots you have, and what cards or chips are currently populating them.
It’s worth running through each section to see what kinds of information are available. One particularly useful section is Ports > USB. Here, you’ll see a list of all your USB controllers, both those provided by your motherboard and any third-party cards you’ve plugged in. You’ll see each controller’s manufacturer and speed at the top level, and by expanding them, followed by Root Hub, you’ll see which devices are attached to which controller. This is handy when troubleshooting problems that seem to only affect certain USB devices.
PRODUCE A SYSTEM REPORT
No audit is complete without some kind of report, and HWiNFO has this covered, too. Click the Save Report button to get started. Choose your output format – the default HTML produces a neatly formatted report, but other options – including CSV for a spreadsheet, or a simple summary copied to the Clipboard – are also available. Click Next.
Most options will then display a list of components to include in your report, which you can check or uncheck as required before clicking Finish. If you choose the summary option, you’ll get a basic list of info about core components for copying to the clipboard, before clicking OK.
Whichever format you choose, you’ll output a potentially lengthy document listing everything you’d see in the program itself. The default HTML version – which you’d view in your browser—does helpfully provide a clickable Table of Contents list at the top to allow you to jump to the specific parts of your system that interest you.
MONITOR SYSTEM HEALTH
Once you’ve audited your hardware, you’ll want to look at ways of keeping an eye on it going forward – and HWiNFO can help here, too. Specifically, its Sensor window lets you monitor temperatures across your PC – you’ll see them fluctuate in real-time, but it also records any maximums, allowing you to spot spikes in temperature that might herald problems, as well as log temperatures over a set period.
Of course, you won’t necessarily want to spend your time keeping close tabs on your system, but would probably prefer to be notified should any specific problems be encountered. HWiNFO allows you to set up your own customised alerts, so you get to choose what changes trigger warnings. Click the Settings button on the Sensors window and switch to the Alerts tab, where you can configure alerts for everything shown in the Sensors window, including temperatures and voltages.
It’s also possible to set alerts for your drives based on their SMART values, but first you’ll need to switch back to the Layout tab to add the required entry – select items from the Hidden Items pane and check ‘Show’ to bring them into view and make them selectable under Alerts. Items to consider include Drive Remaining Life, Drive Failure, and Drive Warning. You’ll see these items appear multiple times – one for each drive – so you’ll need to add them all in.


When enabled, alerts can be configured to trigger a variety of events, from playing a sound to displaying a warning window. How you respond to the alert obviously depends on what the trigger is – signs of a drive failing require immediate backup of data and replacement of the drive, while temperature alerts indicate a need to check inside your case. The usual warnings apply – make sure your PC is fully powered off, and earth yourself before opening the case.
Start by ensuring any dust is carefully removed by following the guide on PC Gamer (www.pcgamer.com/how-to-clean-your-computer-case). Make sure there’s plenty of space between components – tie back cables if necessary or re-route them away from your CPU and GPU if possible. Also, check that existing fans are working as they should, and that case fans are configured so cold air is drawn in one end and warm air is pulled out from the other.
It might also be a good time to investigate new cooling methods – is there room in your case for another fan, or do you simply need to explore more effective cooling (particularly if you have plans to overclock your system)?
MONITOR KEY COMPONENTS
While HWiNFO provides a good overview of your hardware’s health, it pays to explore other available tools that focus on specific parts of your system. Take your hard drives, for instance – all major manufacturers provide dedicated tools for monitoring and tweaking hard drives, particularly SSD and NVMe models.
Identify the manufacturer of your drives, using HWiNFO if necessary, then visit the manufacturer’s support pages to find out what utilities are available for monitoring and testing the drive. Examples include Samsung’s SSD Magician (https://semiconductor. samsung.com/consumer-storage/magician/), Western Digital’s Dashboard (https://support-en.wd. com/app/answers/detailweb/a_ id/10346/), and Kingston’s SSD Manager (www.kingston.com/en/support/technical/ssdmanager).
These tools provide more than just detailed system health reports about your drives – they’re a convenient way to apply firmware updates, run SMART tests (short and long), and give you options for enabling ‘over provisioning’, which can extend the length of your SSD drives in exchange for giving up around 5-10 percent of drive space.
If you’re looking to test your RAM for potential errors that indicate a hardware fault, use Memtest86+ (www.memtest. org). It’s based on the original PCMemtest project, but unlike PassMark’s variant (Memtest86), is free – and open source. You’ll need to create bootable installation media to use it – the simplest solution is to download the ISO file and incorporate it into your Ventoy-powered rescue disk.
Want to keep tabs on your graphics card? MSI Afterburner (www.msi.com/ Landing/afterburner/graphics-cards) is just the tool – not only can you use it to keep tabs on key stats like voltage and temperature, it can display framerates during games (make sure you’ve checked the ‘RivaTuner Statistics Server’ during setup), and can also be used to rein things in if your card is being pushed too far through settings to limit power output and temperature.
We’ll look at it in more detail later.

One often overlooked part of your hardware is the monitor. Given that you can spend hours each day glued to it, it pays to make sure it’s configured correctly. Open your browser and navigate to www.eizo.be/monitor-test/ to run the Eizo Monitor Test. This comprises nine different tests designed to make sure your display is both calibrated correctly and isn’t suffering from defects like dead pixels. You can run the tests individually or go through them all.
If you run into problems that are the result of miscalibration, consult the monitor manual or visit the manufacturer’s website for details on how to correct it using the on-screen display.

KEEP AN EYE ON YOUR BATTERY
If you own a laptop, then your battery is obviously another key component that needs monitoring. You can perform a quick and dirty check using the powercfg command-line tool. Right-click the Start button and choose Terminal (Admin), then issue the following command: powercfg /batteryreport Once the report has been generated, open your C drive and double-click battery-report to view a detailed report in your browser. The summary lets you see how far your battery has degraded by comparing its current ‘Full Charge Capacity’ with its initial ‘Design Capacity’, but scroll down and you’ll see a graph revealing recent usage. Scroll down further to the ‘Battery capacity history’, which will show you how the battery’s capacity has declined over time.
From this, you can extrapolate how much life remains in your battery, or utilise third-party software to do the calculations for you, amid other useful monitoring and optimising features.
One such tool – free for personal use – is BatteryMon (www.passmark.com/products/batmon/). Among its capabilities is a graph projecting the decline of your battery’s charge over time – it can also monitor any UPS batteries plugged into your PC.
If you’re willing to pay, Smarter Battery (US$ after trial, www.microsys.ro/smarterbattery.htm) provides both monitoring and optimisation tools, designed to extend the life of your battery. It also provides a means of analysing battery performance over time, providing you with projections of its remaining life.

PERFORM A STRESS TEST
One way to check the health of your PC’s components is through running a stress test. If you’re a heavy duty gamer or dabble in high-end video editing, you’ll already be pushing your PC to its limits on a regular basis, but if you’re looking to overclock your system or are worried about recent instabilities potentially being linked to failing hardware, a stress test is the way to go to determine if there’s an underlying problem that may need correcting (such as easing back on overclocked settings or improving cooling to key components).
Any benchmarking tool will do, but there are dedicated stress-testing tools too: BurnInTest (US$ after free trial, www.passmark.com/products/burnintest/) is one of the most comprehensive out there, and aim firmly at professionals as well as enthusiasts, so you know you’ll be well covered.
BurnInTest goes way beyond the system’s core components to include tests for peripherals such as webcams, USB ports, monitors, printers, and keyboards.
FREE STRESS TESTING
If you’re operating on little (or no) budget, then you can still stress-test your core components: CPU, GPU, RAM, and hard drives. One free option is Jam Software’s HeavyLoad (www.jam-software.com/heavyload?ca=1), which tests your key components from the CPU and GPU to hard drive and RAM.
Portable and installer options are available – launch HeavyLoad and open the Test Options menu to choose which tests to run (CPU and GPU stress tests are enabled by default). Once done, click the play button to run the tests, which will run continuously until your PC falls over or you click the stop button.
Other tools worth considering for stress tests – particularly when overclocking your CPU and/or RAM – include Prime95 (www.mersenne.org/download/#stresstest). UNIGINE’s real-time 3D engine can also be used for a wider stress test that encompasses the GPU, PSU, and cooling systems. It’s free, and a variety of models are available, but check your hardware meets the spec before downloading one from its website (https://benchmark.unigine.com/).
When evaluating other tools, proceed with caution – for example, both IntelBurnTest (Intel CPUs, www.techpowerup.com/download/intelburntest/) and FurMark (GPU, https://geeks3d.com/furmark/) are known to push stress testing to extreme levels. You might get a quicker answer to your questions about stability, but only at the risk of potentially damaging your previously functioning components.
Whichever stress-testing tool you go with, it’s a good idea where possible to keep a close eye on your components as the tests are being run – have HWiNFO’s Sensors window open to monitor system temps, for example.
UPDATE HARDWARE
Once you’re happy with the condition of your components, make sure the underlying firmware and software is up to date. When it comes to your motherboard’s BIOS, you can get its current version (including date) from HWiNFO’s Summary window. Head over to the support section of your motherboard’s website and look under Support or Downloads to see what the latest version is. There may have been multiple updates since you looked – most updates add support for newer CPUs, but some can plug security holes and fix bugs.
The update procedure varies from motherboard to motherboard – some allow you to search for updates from within the UEFI itself (although be prepared to change server location if you run into an error while downloading an update), but most expect you to download the file to a flash drive and select it manually when you next boot into the UEFI.
Hard drive firmware can be updated via manufacturer drive utilities, while the latest version of drivers can be sourced from a variety of locations. When it comes to your graphics card, installing a tool like NVIDIA’s Control Panel gives you access to the latest drivers over and beyond those offered by Windows Update.
Your motherboard manufacturer may offer an all-encompassing driver updater tool, which should at ensure any onboard components like chipset and networking drivers remain updated going forward. Failing that, compare the version number of drivers offered on its website with those shown under Device Manager (right-click the Start button), which you’ll find on the item’s Driver tab on its Properties dialog.
If you’re struggling to identify certain pieces of hardware – Device Manager is often quite unhelpful in this regard – head to www.tweaking.com to try its Hardware Identify tool. Launch this and click Update to update its database to the latest version before reviewing a complete list of all detected devices. These include ‘standard system devices’ like the power button or numerous ‘PCI standard host CPU bridges’ – filter the list by switching to the ‘All Except Standard System Devices’ tab.
Double-click an entry to reveal more about it – if you don’t recognise it, then you’ll see a list of possible matches shown, with the most likely match (or matches in the case of CPU models) highlighted in yellow. There’s also a link to perform a Google search for the Hardware IDs associated with the entry, in case you’re looking for more information online.
Hardware Identifier also identifies hardware devices with no drivers in place or problems – again, switch to the relevant tab to learn more. You may well see one entry marked as ‘Unknown’ with a Hardware ID of HTREE\ROOT\0—this can be safely ignored.
If you’re struggling to track down a specific driver, or feel too lazy to go hunting for drivers from different manufacturers and websites, consider a third-party driver updater tool. Many tend to be bundleware, which is why the safest tool for the job is also the least user-friendly, such as Snappy Driver Installer (www.glenn.delahoy.com/snappy-driver-installer-origin/) to update your drivers, including hard-to-identify ones.

TUNE HARDWARE PERFORMANCE
Once you’re happy that your hardware is functioning correctly and has the best possible drivers installed, you may feel that you’ve done enough. But why settle for maintaining your hardware when you can tune it to boost performance?
The obvious solution is to overclock key components, most notably your CPU, RAM, and graphics. While this can be done from within your motherboard BIOS/UEFI, it’s also possible to tune up your PC within Windows itself to save you the hassle of having to shut down and restart.
Before you begin, read the section on benchmarking your PC – this will allow you to compare your PC’s performance before and after overclocking, allowing you to find a sweet spot between speed and system stability.
Once you have your reference benchmark in place, let’s start overclocking your GPU with the previously referenced MSI Afterburner. It uses a separate tool – MSI Kombustor – to stress-test your overclocked settings, which you’ll need to download from www.geeks3d.com/furmark/kombustor/d.php. You can run this standalone or access it via the ‘K’ button in Afterburner.
You can choose from a variety of stress tests, set your screen resolution, and choose what on-screen additions to include (we recommend checking ‘Display GPU monitor graph’ to monitor GPU temperature). Click ‘RUN stress test’ and see how the card performs at various levels and what temperature it’s running at. You can also benchmark the system.
Press Esc to quit out of this and return to the main Afterburner dialog. From here, there are two ways to overclock your system – the first lets Afterburner determine the best settings for you. To do this, click the OC Scanner button on the left followed by Scan. Once complete, Afterburner will have applied a modest overclock, which you can benchmark and stress-test using Kombustor.
If you’re looking to push things further, then you can use the sliders on the main Afterburner screen. Give yourself more headroom by nudging the Power Limit and Temperature sliders up, then start to play with the Core Clock (MHz) and optionally the Memory Clock too. Move upwards in small increments, and always stress-test your tweaks to get the right balance between stability and performance.
If you’re looking to push things further, you’ll want to boost your cooling options. Click Settings > Fan tab, check ‘Enable user defined software automatic fan control’, and create a steep fan curve to bring the fans up to full power to keep GPU temps down.
Once you’re happy with your overclock, click the floppy button at the bottom of the screen to save it to one of the four available slots on the right. Once saved, click the revert button to go back to normal settings. Going forward, you can invoke the overclock when you need it (for gaming, say) simply by clicking its button followed by Apply.


OVERCLOCK YOUR CPU
You can overclock your CPU directly from your PC’s BIOS/UEFI, but an easier option is to make use of the Windows utilities on offer from your CPU manufacturer, namely the Intel Extreme
Tuning Utility (www.intel.com/content/www/us/en/download/17881/) or AMD Ryzen Master (www.amd.com/en/technologies/ryzen-master). Make sure your CPU is supported by checking the compatibility list – more AMD chips are covered than Intel ones.
Intel’s XTU comes with built-in benchmarking so you can compare the effects of overclocking on your system, while Ryzen Master offers basic and advanced modes depending on how technical you want to get. Version 2.9 of the latter also introduces a new ‘Curve Optimiser Mode’ option for the latest 5000-series CPUs and above, which allow you to further tune the overclock.
When you switch to Advanced view in Ryzen Master, be sure to click Help for a detailed guide about how to proceed. Two built-in presets – Creator and Game – are supplied, with room for two additional profiles if you want to push the envelope even further. Remember that overclocking is done entirely at your own risk – consider upgrading your cooling if you’ve not done so already.
AUDIT YOUR NETWORK
A key part of your hardware is your network – so when it comes to auditing and maintaining it, you need to cast a wider net than just your main PC. We recommend the open-source NETwork Manager (https://github.com/BornToBeRoot/NETworkManager), which has all the core tools you need.
“ON FIRST LAUNCH, YOU’LL GET AN OVERVIEW LISTING YOUR PC, ROUTER, AND PUBLIC IP ADDRESSES.”
On first launch, you’ll get an overview listing your PC, router, and public IP addresses, along with any DNS information. Below this is Network Interface providing three tabs. Information is self-explanatory, while Bandwidth allows you to monitor downloads and uploads. Configure provides a section for configuring the various network interfaces on your machine.
Beneath this is Wi-Fi, which is useful, as it lists all visible networks and helps you see which channels are congested via its Channels tab. If you want to move your Wi-Fi network to a less congested channel, however, you’ll need to manually log into your router to do so.
Below this is a tool for scanning your network to see what devices are currently connected – you’ll get their IP address, hostname if one is provided, plus port status (open or closed), and whether they’re contactable via a simple ping. If any aren’t identifiable, switch to the ARP tool, where you’ll see a list of IP and MAC addresses. Right-click your device, choose Copy > MAC Address, then switch to the Lookup section and paste in the MAC address to list its manufacturer.
We also recommend you look at Connections, where you’ll be able to see precisely what your PC is connected to – both locally and over the internet, and on which ports.
There are too many tools offered by NETwork Manager to list here – you’ll probably find it renders many existing networking tools like Putty for ssh connections redundant. Visit https://borntoberoot.net/ NETworkManager/Documentation for comprehensive documentation.

GIVE WINDOWS THE ONCE-OVER
With your hardware checked over, it’s time to move on to Windows itself. There are many built-in tools to help look at your operating system, but they’re not all grouped together in one convenient place. For this job, we recommend tweaking.com’s Windows Repair tool, which makes it easy to run these tests from a single spot.
After installing, reboot your PC into Safe mode – the quickest way to do this is to press Win-R, type msconfig, and press Return. Switch to the Boot tab, check ‘Safe boot’, and make sure ‘Network’ is selected before clicking OK and rebooting when prompted.
After you’ve logged into your user account in Safe mode, launch Windows Repair. We’re not actually interested in its repair tools – although do explore them if you’ve been experiencing certain glitches or problems. Instead, work your way through the four steps, starting with the power reset, which is designed to drain all power (and possible glitches) from your system. Once done, you’ll automatically reboot back into Safe mode, so launch Windows Repair again, and skip to step two.
Click ‘Open Pre-Scan’, followed by ‘Start Scan’ to perform three scans. If the Windows Package File scan finds any missing files, then make a note of the files and move on.
After you’ve performed your pre-scan, perform a disk check of the system drive (run it read-only to avoid a reboot – if any errors are found, then click the button to schedule a reboot for later), and round off your basic checks by allowing System File Checker to run. If it finds any corrupt files, it will fix them.
Once complete, we recommend opening any security tools that you have and running full scans while still in Safe mode before reopening msconfig to the Boot tab, unchecking ‘Safe boot’ and clicking OK to return to Windows proper.
“AFTER YOU’VE PERFORMED YOUR PRE-SCAN, PERFORM A DISK CHECK OF THE SYSTEM DRIVE”

BENCHMARK: BEFORE & AFTER
When you come to tune your PC’s hardware, you’ll want to benchmark it before you make your changes to see what effect your overclocking has on your system. But it’s also worth benchmarking your PC as part of your system checkup. In this instance, benchmarking in isolation tells you very little about the state of your computer, so it pays to benchmark every few months to see if performance dips during that period.
“A COMMON CAUSE OF SLUGGISH PERFORMANCE IS HEAT.”
It’s also good to compare the results of your benchmark with similar setups, so you can see if your PC is performing as it should given its spec. If your PC meets expectations, you can move on to overclocking and repeating the test to see whether you can eke out any noticeable performance gains.
If, on the other hand, your PC falls below expectations, it may indicate an issue that needs addressing. A common cause of sluggish performance is heat, resulting in thermal throttling as your CPU and other components deliberately slow down to prevent damage. If the temperature readings from HWiNFO appear to support this, open your PC case and make sure it’s dust-free and everything is working.
When it comes to benchmark software, there’s a range to choose from. PC UserBenchmark (www.userbenchmark.com/Software) lets you compare your system with other users, although there have been controversies about the weighting of its results. However, for the purposes of comparing like for like, it’s a good choice – and free.
Other options include Cinebench (www.maxon.net/en/cinebench), which is also free, but CPU-focused, along with MSI Kombustor for your GPU. Don’t forget MSI Afterburner’s real-time FPS counter to measure real-world improvements when playing your favourite games.